

Corporate Training
Employee Training

Part of what can make Wranx so powerful for organisations are the learning principles on which it is based, like Spaced Repetition and Certainty Based Marking (CBM). To make the most of our – or any – platform, though, you need to understand the impact it is having and be able to measure employee learning, which is why we’ve rolled out our new, in-built analytics platform.
The new platform replaces Wranx’s previous organisation reporting page. Although currently in beta, it is significantly more sophisticated and delivers powerful insights into employee learning performance and how that is translating into results for organisations as a whole.
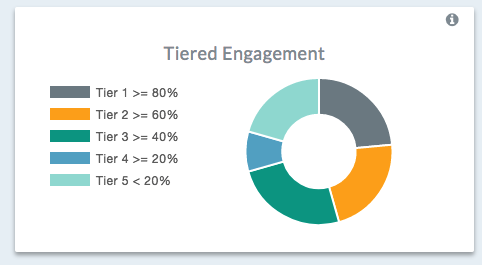
Among the actionable insights made available is information like which employees are high performing and which have the highest training needs in specific areas. Organisations can also see the different levels to which employees are engaging with Wranx and the cumulative training data for particular drills.
Organisations can drill down and filter specific areas of interest. Built in filters can give a historic view of data across different individuals or groups, custom date ranges and content drills or assessments. Using this functionality, it’s also possible to compare different sets of data and track progress.
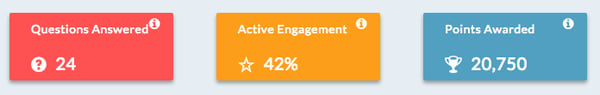
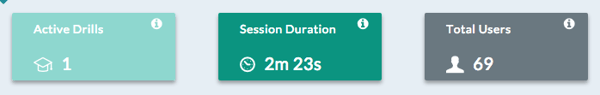
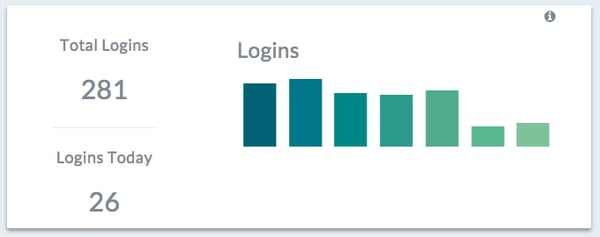
In addition to deep insights, the new analytics platform makes information more quickly accessible, with snapshot dashboard pages showing organisations things like how many drills they have live, the number of questions that employees are answering and the average length of time employees are using Wranx for. This info helps to show how Wranx is being used by organisations and where they might be able to make improvements.
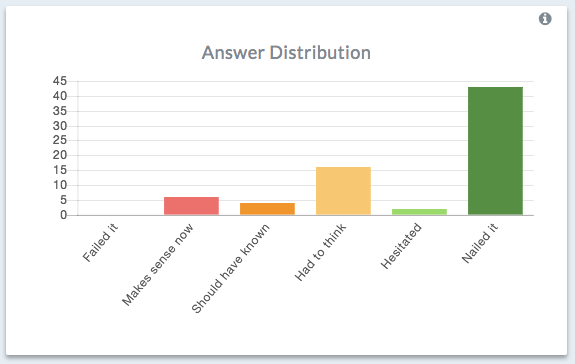
A content dashboard provides a high-level overview of engagement – the extent to which employees are actually using Wranx – with different drills and assessments among employees. From here you can see info like the amount of total time employees have spent using Wranx, the number of questions answered by type and user certainty versus accuracy when answering CBM questions.
There’s also a user dashboard that gives organisations a way to focus on the learning engagement and performance of individual users. Here, it’s possible to drill into the number of questions a user answered, the points they’ve been awarded, how engaged they are, the number of questions they answer per day and the time they spend using Wranx, among other things.
Employees, of course, still have their own, personal dashboards that show things like their number of consecutive days learning via Wranx, information about questions they’ve found difficult and a leaderboard showing their performance against other employees.
The information provided via the Wranx analytics platform shows what is working well for organisations and what can be improved, allowing them to incrementally develop the learning that is delivered. Naturally, the analytics functionality will continue to be developed, with ever more detailed insights delivered on which for organisations to make informed, data-driven decisions.